2026 A-Level H2 Economics Paper 1 suggested answers (Poland and aircraft case studies)
Paper 1 is done. Here is every part of both case studies, worked through by MACRO Academy's Head of Economics within a day of the paper, plus the full answer key as a free PDF.
 By Rushil Srinath, Head of Economics, MACRO Academy
· 12 min read
On this page
- 2026 H2 Econs Paper 1 at a glance
- Case study 1: Poland’s economy
- 1(a) Why Poland’s GDP growth was forecast to slow in 2023 [4 marks]
- 1(b) Why higher GDP per capita doesn’t mean everyone is better off [4 marks]
- 1(c) Migrants and Poland’s PPC [2 marks]
- 1(d) Why Poland’s budget deficit widened [2 marks]
- 1(e) Is labour cost the main reason firms nearshore to Poland? [8 marks]
- 1(f) Do Poland’s FDI incentives create a conflict in macro objectives? [10 marks]
- Case study 2: Aircraft and air travel
- 2(a) Why commercial aircraft manufacturing is an oligopoly [2 marks]
- 2(b) How Boeing and Airbus cause allocative inefficiency [4 marks]
- 2(c) More competition in aircraft and airline revenue [4 marks]
- 2(d) Opportunity cost of building an airport [2 marks]
- 2(e) Do new airports only benefit the countries building them? [8 marks]
- 2(f) Is subsidising sustainable transport the best fix for air travel emissions? [10 marks]
- Where marks were most likely lost
- Download the full 2026 Paper 1 answer key
- Download the PDF
H2 Economics Paper 1 (syllabus 9570, paper 01) for the 2026 A-Levels was sat on 5 November 2026. These are suggested answers for every part of both case studies, written by Rushil Srinath, Head of Economics at MACRO Academy, within a day of the paper.
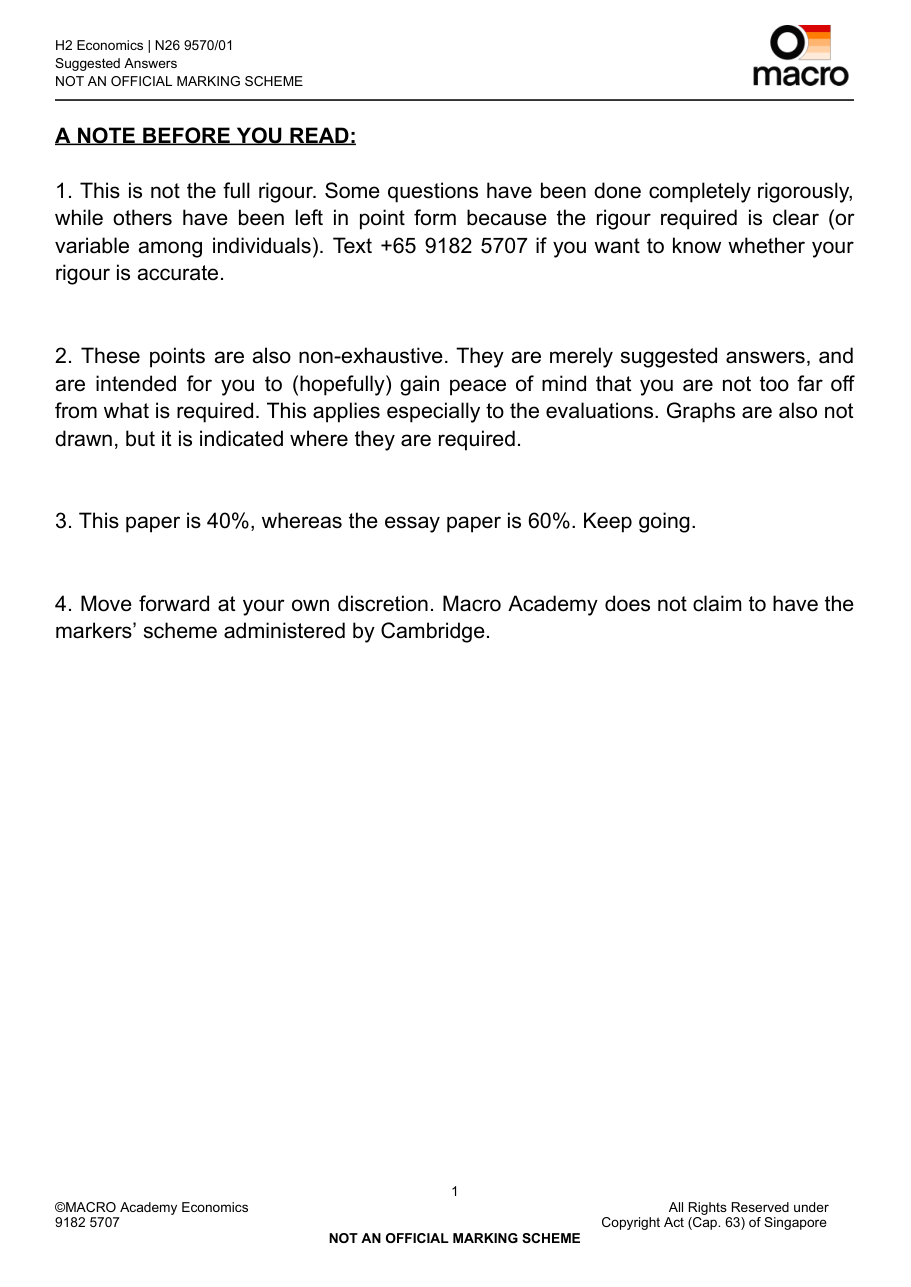
They are not the official marking scheme, which SEAB and Cambridge never publish. They are meant to give you peace of mind that you weren’t far off, and to show where the marks most likely were. Some answers are in full; others are in point form where the required depth is clear. Diagrams are described rather than drawn.
Want the full key? The 14-page PDF is free, with every chain of analysis and evaluation point. Jump to the PDF.
2026 H2 Econs Paper 1 at a glance
Two case studies, 30 marks each. The table shows what each part tested. Question wording below is paraphrased; use your copy of the paper for the exact text.
| Question | Marks | What it tested | Core concept |
|---|---|---|---|
| 1(a) | 4 | Why Poland’s growth was forecast to slow in 2023 | AD/AS, investment, cost-push |
| 1(b) | 4 | Why higher GDP per capita doesn’t prove all citizens are better off | Standard of living |
| 1(c) | 2 | How migrants joining the labour market benefit Poland | PPC, potential growth |
| 1(d) | 2 | Why Poland’s budget balance changed from 2021 to 2022 | Fiscal balance |
| 1(e) | 8 | Is labour cost the most important reason firms nearshore to Poland? | Costs, revenue, profit maximisation |
| 1(f) | 10 | Do Poland’s FDI incentives cause a conflict between macro objectives? | Multiplier, demand-pull inflation, LRAS |
| 2(a) | 2 | Why aircraft manufacturing is an oligopoly | Market structure |
| 2(b) | 4 | How Boeing–Airbus dominance causes allocative inefficiency | P > MC, deadweight loss |
| 2(c) | 4 | How more competition among aircraft makers affects airline revenue | Supply shift, PED and total revenue |
| 2(d) | 2 | Why an airport might not be “beneficial” after all | Opportunity cost |
| 2(e) | 8 | Do new airports only benefit the countries building them? | Multiplier, exports, potential growth |
| 2(f) | 10 | Is subsidising sustainable alternatives the best policy for air travel emissions? | Negative externalities, subsidy vs tax |
Case study 1: Poland’s economy
The first case study was about Poland: slower growth after Russia’s invasion of Ukraine, more than 1.5 million Ukrainian migrants, a wider budget deficit, and European firms moving production closer to home (“nearshoring”) with help from Poland’s special economic zones.
1(a) Why Poland’s GDP growth was forecast to slow in 2023 [4 marks]
Two reasons, each a full chain:
- Energy costs (supply side). The war disrupted energy supplies, so firms had to source electricity, coal and gas elsewhere at higher prices. Higher unit costs make output less profitable at each price level, so aggregate supply falls and real GDP growth is held back even as spending keeps rising.
- Slower investment growth (demand side). Investment growth slowed from 4.6% to 1.2%. Price instability makes future costs and returns harder to predict, so firms invest less than they otherwise would. A smaller rise in investment means weaker AD growth, so output and incomes rise by less: GDP growth slows from about 4.9% to about 0.3%.
The trap: GDP and investment are still growing. This is a slowdown in the rate of growth, not a fall in the level of GDP. Say so explicitly.
1(b) Why higher GDP per capita doesn’t mean everyone is better off [4 marks]
Any two of these, each linked to material or non-material standard of living (SOL):
- Distribution. GDP per capita is an average. If income is unequally distributed (a rising Gini coefficient, from the Lorenz curve), some citizens’ purchasing power hasn’t risen, so their consumption, and material SOL, may not have either. The phrase “for all its citizens” is pointing you here.
- Quality of life. GDP counts output, not wellbeing. If more output came from longer hours, more stress or more pollution, health worsens and non-material SOL falls.
- Inflation. A rise in nominal income alongside high inflation can mean lower purchasing power, so people consume fewer goods and services and material SOL falls.
Revise: comparing standard of living with national income and the model essay on why GDP per capita is insufficient.
1(c) Migrants and Poland’s PPC [2 marks]
More workers means a greater quantity of resources, so the maximum combinations of goods and services Poland can produce with full and efficient use of resources rise. That’s an increase in productive capacity (potential growth).
Diagram: the PPC shifts outward from PPC₀ to PPC₁, with both axes labelled; combinations that were previously unattainable are now attainable. See the PPC and economic growth.
1(d) Why Poland’s budget deficit widened [2 marks]
- Describe: the budget balance went from −1.8% to −3.5% of GDP, so the deficit widened by 1.7 percentage points.
- Explain: supporting more than 1.5 million Ukrainian migrants required more government spending on transfer payments and infrastructure. Spending rose without an equal rise in tax revenue, so revenue minus expenditure became more negative.
1(e) Is labour cost the main reason firms nearshore to Poland? [8 marks]
Thesis: lower labour cost raises profits. Figure 2 shows hourly labour costs of about 15 in Poland against about 41 in Germany. For comparable productivity, lower wages cut labour cost per unit, which lowers both average cost and marginal cost. Profit-maximising firms produce where MR = MC; with lower MC and AC, the profit area grows. Draw lower MC and AC curves and shade the larger profit.
Anti-thesis: proximity and reliability can matter more. The case notes that during COVID, deliveries from China stretched to 12–15 months, with record shipping costs. Poland’s closeness to EU customers and its infrastructure mean fewer disruptions and lost sales, so demand for these firms’ goods rises (AR and MR shift right). Reliable supply also makes demand more price-inelastic, giving firms more price-setting power and larger profits. Draw higher AR and MR and show the larger profit.
Evaluation:
- Figure 2 also shows Hungary and Romania with lower hourly labour costs than Poland, so wages alone can’t explain why firms pick Poland.
- Skill shortages and wage pressure can erode Poland’s cost advantage over time.
- Labour cost matters most for labour-intensive firms; for others, market access may dominate.
Revise: profit maximisation and levels of profit.
1(f) Do Poland’s FDI incentives create a conflict in macro objectives? [10 marks]
Thesis: likely a short-run conflict between growth and price stability.
- Tax cuts in special economic zones raise expected after-tax returns, and grants cut investment costs, so more projects become profitable. If foreign firms actually invest in Poland, that’s an injection of autonomous expenditure: firms expand and hire, factor incomes rise and induced consumption follows. Each round shrinks through saving, tax and import withdrawals, but output and employment rise by a multiple.
- Near full capacity, firms compete for scarce workers and inputs, pushing up factor prices and unit costs, so they raise prices: demand-pull inflation alongside growth. The case’s evidence: skill shortages, strong wage growth and 14.4% inflation in 2022.
- Diagram: AD shifts right on the steep range of the AS curve.
- Limits: the size of the multiplier, how much spare capacity there is, and how large the investment is relative to GDP.
Anti-thesis: the conflict need not persist.
- Productive FDI adds plant and machinery, raising the capital stock and shifting LRAS right. More capacity means less pressure on factor prices, so demand-pull inflation needn’t last.
- Technology transfer raises productivity (output per worker) and lowers unit costs, so output and employment can grow with less price pressure.
- Minor point: FDI inflows improve the financial account and the balance of payments.
- Limits: it depends on whether productivity actually rises, and on whether the capital is footloose.
Evaluation:
- A conflict is likelier when the investment spending arrives before the new capacity does, especially with skill shortages. It’s weaker with spare capacity or fast productivity gains.
- Migrants add labour, but mostly lower-skilled entrants don’t fix skilled shortages.
- Grants cost money and lower tax rates reduce revenue for a given tax base; the net budget effect depends on how much extra investment and taxable income follow.
- Judgement: a real short-run risk of conflict, but not an inevitable or permanent one if the government plans well.
Revise: the multiplier effect, demand-pull inflation, the AS ranges, and the model essays on goal conflicts from productivity-driven growth and FDI and living standards.
Case study 2: Aircraft and air travel
The second case study covered commercial aircraft manufacturing (dominated by Boeing and Airbus), airlines, the boom in new airports across Asia-Pacific, and what to do about air travel emissions.
2(a) Why commercial aircraft manufacturing is an oligopoly [2 marks]
- Few dominant firms: Airbus has over 59% and Boeing just under 40% of the global market for commercial aircraft.
- High barriers to entry: new entrants lack the economies of scale to match the incumbents’ unit costs and stay profitable, so the industry keeps few competitors.
2(b) How Boeing and Airbus cause allocative inefficiency [4 marks]
The allocatively efficient output is where P = MC (Q₁): the value consumers place on the last unit equals the cost of producing it. Profit-maximising firms instead produce where MR = MC (Q₂), which is lower, at a higher price P₂. Between Q₂ and Q₁, each extra unit would be valued above its cost, so the market underproduces by Q₁Q₂ and there is a deadweight loss. If every firm in the industry does this, resources are misallocated more broadly.
Tip: the diagram is a standard template; contextualise it to Boeing and Airbus to get the marks. See allocative efficiency and efficiency in market structures.
2(c) More competition in aircraft and airline revenue [4 marks]
More competition among manufacturers can lower aircraft prices and spur innovation. The case links newer, fuel-efficient aircraft to lower operating costs, and older planes to costly maintenance. If airlines’ cost of providing journeys falls, supplying flights is more profitable at every fare, so supply of air travel increases. At the old fare there is a surplus, fares fall, and the new equilibrium has a lower price and higher quantity.
Total revenue = P × Q. If demand is price-elastic (PED > 1), the percentage rise in quantity exceeds the fall in price and airline revenue rises; if price-inelastic, revenue falls. Define PED and give a reason for the value you choose (for example, leisure travel with close substitutes vs business travel).
2(d) Opportunity cost of building an airport [2 marks]
Opportunity cost is the benefit of the next best alternative forgone. The case stresses that low-income countries have scarce funds. Spending money, land and labour on an airport means they can’t be used for the next best alternative, such as healthcare. Even if the airport brings benefits, the healthcare forgone (for example, higher productivity and incomes from a healthier population) could be greater. See applying opportunity cost.
2(e) Do new airports only benefit the countries building them? [8 marks]
This question split students. Is it asking about benefits and costs to the country building the airport, or whether only those countries benefit? Rushil reads it as the first, but expects markers to credit both readings. Either structure works:
Option A: domestic benefits vs benefits to other countries
- Domestic: construction spending is autonomous government expenditure, raising demand for construction and services, hiring, incomes and further rounds of spending (the multiplier), cutting cyclical unemployment if there is spare capacity. In the long run, more tourism is an export that raises AD the same way; the case cites 127 Asia-Pacific airport projects worth US$217bn and a terminal adding 50 million travellers a year. More passenger and cargo capacity also raises productive capacity (potential growth).
- Other countries: imported construction equipment and services are exports for supplier countries, raising their actual growth and improving their balance of trade.
Option B: domestic benefits vs domestic costs
- Benefits as above; costs include negative externalities from construction and flights, which make growth less sustainable. (Rushil advises against leaning on demand-pull inflation here; it repeats Case study 1.)
Evaluation: if passengers don’t come, the capacity sits idle; construction draws resources from alternatives; more flights mean environmental costs; borrowing adds debt servicing; and in a low-income country the healthcare or education forgone may be large. Reject “only”, but the size and spread of the benefits depend on domestic sourcing and ownership, actual demand, connecting routes and financing.
Rushil’s take: this is a broad question that eats time. Like every year, part of what it tests is prioritisation.
2(f) Is subsidising sustainable transport the best fix for air travel emissions? [10 marks]
Structure: explain the market failure first, then policy 1 with limits, then policy 2 with limits, then judge.
The market failure. Burning jet fuel creates emissions that harm third parties (for example, higher risk of respiratory illness) who are neither buyers nor sellers of air travel and aren’t compensated. These external costs aren’t priced, so private costs fall short of social costs, and the free market over-allocates resources to air travel beyond the socially optimal level: a deadweight loss. See negative externalities.
Policy 1: subsidise a less polluting substitute. The case proposes high-speed rail for long-distance domestic travel. A per-journey subsidy to rail operators cuts their unit costs, so rail supply rises and rail fares fall. Because rail and air travel are substitutes (positive cross elasticity), demand for air travel falls, cutting flights, emissions and the deadweight loss.
- Limits: switching depends on how close a substitute rail really is. It’s weak for flights across oceans and for travellers whose time is costly, and rail capacity can’t expand quickly. Subsidies also cost public funds (an opportunity cost), and new infrastructure takes years.
Policy 2: a corrective emissions tax. A tax equal to the marginal external cost makes airlines bear the harm: private cost rises to match social cost, output falls to the socially optimal level and the deadweight loss is removed. It also rewards airlines for cutting emissions per journey, and it raises revenue instead of needing a subsidy budget (though administering it costs money).
- Limits: governments can’t measure MEC precisely; set too low, overproduction remains; too high, a new welfare loss appears. Demand that doesn’t respond much to price limits short-run switching, especially without alternatives. The case also flags limited government appetite for radical action, and new fuels and technology are long-term.
Evaluation: a subsidy fits routes that have a lower-emissions close substitute with capacity to take the extra travellers. A tax targets the unpriced cost more directly across all routes, but depends on calibration and public acceptance. The strongest answer combines them: use the tax revenue to fund the subsidy for the less polluting alternative.
Revise: correcting negative externalities, cross elasticity of demand, and the model essays on a carbon tax vs subsidising solar and Malaysia’s departure tax and airlines.
Where marks were most likely lost
- 1(a): writing that GDP or investment fell. Both still grew, just more slowly.
- 1(b): ignoring “for all its citizens”, which signals income distribution.
- 1(f): asserting that FDI raises investment without the condition that firms invest in Poland, and never reaching a judgement on whether the conflict persists.
- 2(b), 2(c): template answers with no reference to Boeing, Airbus or airlines.
- 2(e): spending too long on a deliberately broad question.
- 2(f): jumping into policies without first explaining the externality.
Download the full 2026 Paper 1 answer key
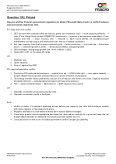
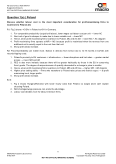
The PDF has the complete answer for every part, including the full chains of analysis and all evaluation points. It’s free: tell us who you are and it unlocks straight away.
Get the 2026 H2 Economics Paper 1 suggested answers (PDF)
Five quick questions, then the full 14-page key opens here. Free.
FAQ
When was the 2026 A-Level H2 Economics Paper 1?
H2 Economics Paper 1 (9570/01), the case study paper, was sat on 5 November 2026 in Singapore. These suggested answers were published the next day.
Is this the official 2026 H2 Economics marking scheme?
No. SEAB and Cambridge do not publish marking schemes for the A-Levels. This is an independent set of suggested answers by Rushil Srinath, Head of Economics at MACRO Academy, to help you check whether you were on the right track.
What were the 2026 H2 Econs Paper 1 case studies about?
Case study 1 was on Poland's economy (slowing growth, Ukrainian migrants, the budget deficit, firms nearshoring to Poland and government incentives for FDI). Case study 2 was on commercial aircraft and air travel (the Boeing–Airbus oligopoly, airline revenue, new airports and air travel emissions).
How much is H2 Economics Paper 1 worth?
Paper 1 is two case studies worth 30 marks each, and counts for 40% of the H2 Economics grade. Paper 2, the essay paper, counts for the other 60%.
How do I download the 2026 H2 Econs Paper 1 answer key PDF?
Fill in the short form at the end of this post (name, email, school, and who you are). The 14-page PDF unlocks immediately, to read in your browser or download.
Rushil Srinath
Rushil leads H2 Economics at MACRO Academy, where his 2025 cohort achieved a 70% distinction rate. He is known for hand-marked, line-by-line essay feedback and one unified answering framework that students use across case studies and essays. "Economics is a new subject for most students. It has little precedent at the secondary school level, yet many of my students have found it to be one of the most rewarding disciplines."